


Let's Play Connect The Dots!
Let's Play Connect The Dots!
The Shift Within: How We End Oppression and Divisiveness to Create Liberation and Indivisibility for All

I’m blogging a book! Click here to start at page one or jump right in below.
Let's Play Connect The Dots!
In this post I’m going to invite you to participate in an activity that requires a sheet of paper and a writing utensil. The activity is even more impactful if you have blank paper and colored pencils.
Systems thinking requires a paradigm shift in how we perceive the world. It requires being able to perceive dynamic complexity, feedback loops, and interconnections. A Systems Thinking tool that is used to gain deeper insights into the interconnectivity and interrelationships of the elements within complex systems is the Cluster Map. Systems mapping tools like the cluster map provide a visual exploration of systems and make it easier to communicate gaps in understanding, intervention points, and insights (5).
For example, we can take any element from our concentric circles diagram of human-made systems and zoom in to gain deeper insights using a Cluster Map.
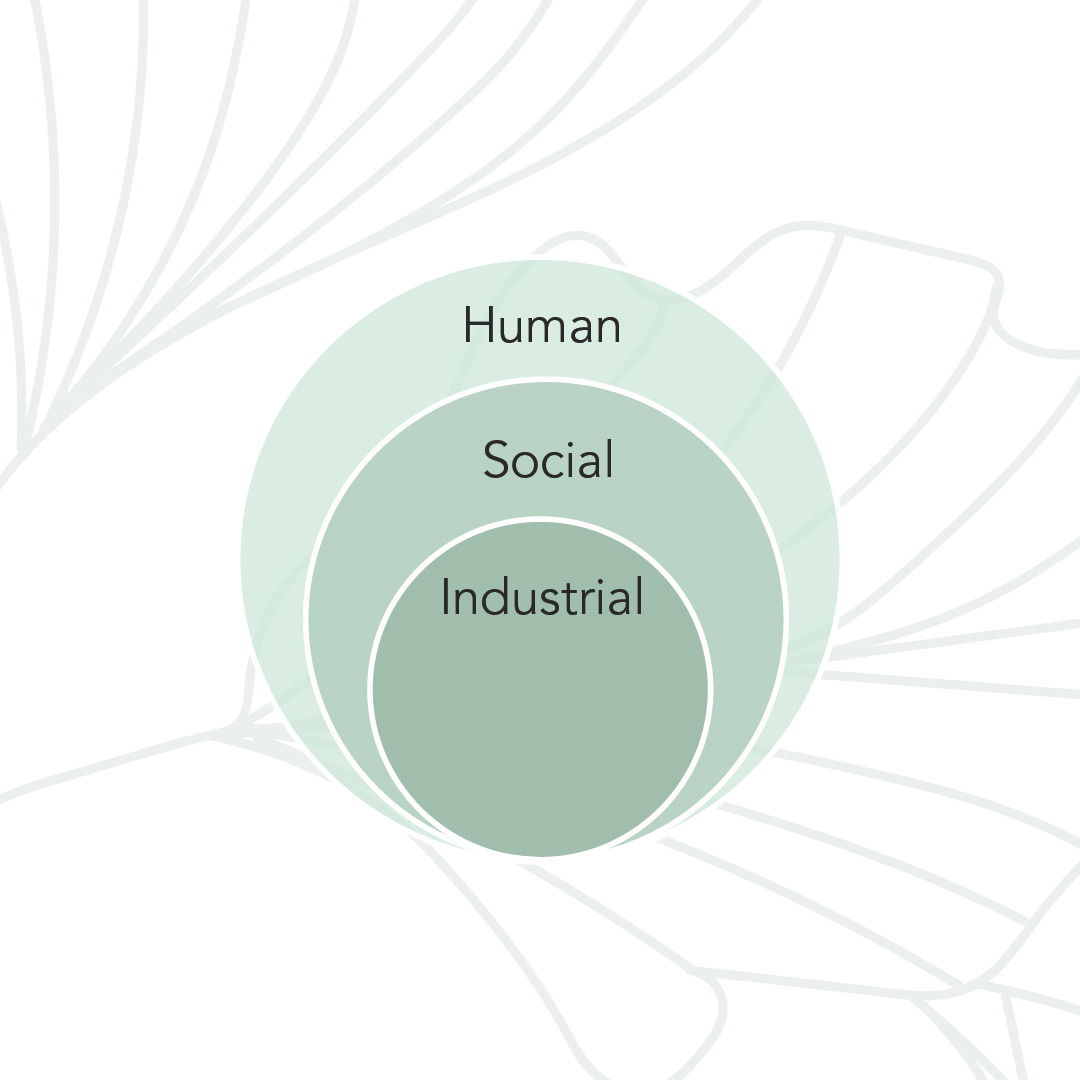
A concentric circles diagram of human-made systems.
Let’s zoom in and take a closer look at social systems. The best way to create a cluster map is to draw it on a sheet of chart paper. This can be done individually however it’s even more powerful when it can be created and discussed within a group setting. On a sheet of chart paper draw a large circle and write social systems in the middle. Then think about all of the variables, elements, agents, actors, components, etc. that make up and support our human societies and cultures (our social systems). This is a brain dump activity, there are no right or wrong answers, so write down as many elements as you can think of. See the example that I created below.
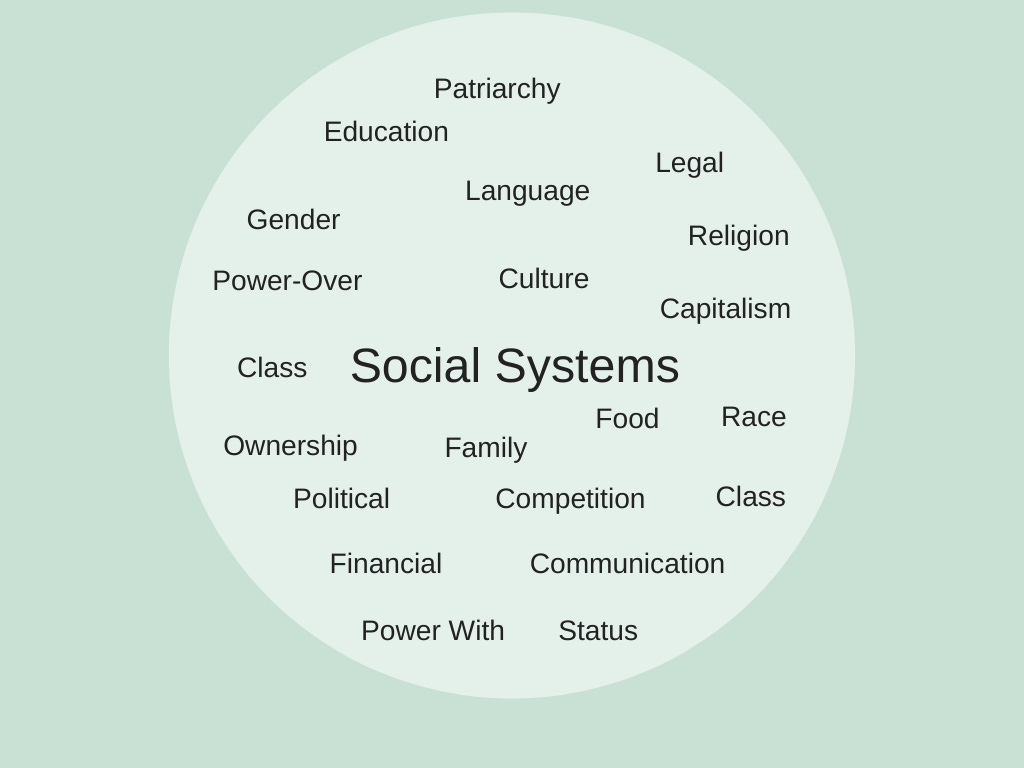
An example cluster map of social systems.
Next, grab a writing utensil and draw lines connecting all of the elements that have relationships with one another or whose activities impact one another in some way. After completing this step you should have a really messy circle with lots of lines. This is a good visual to see because it illustrates the messiness and complexity of dynamic systems. You should also notice that every element is either connected directly or indirectly through a common relationship.
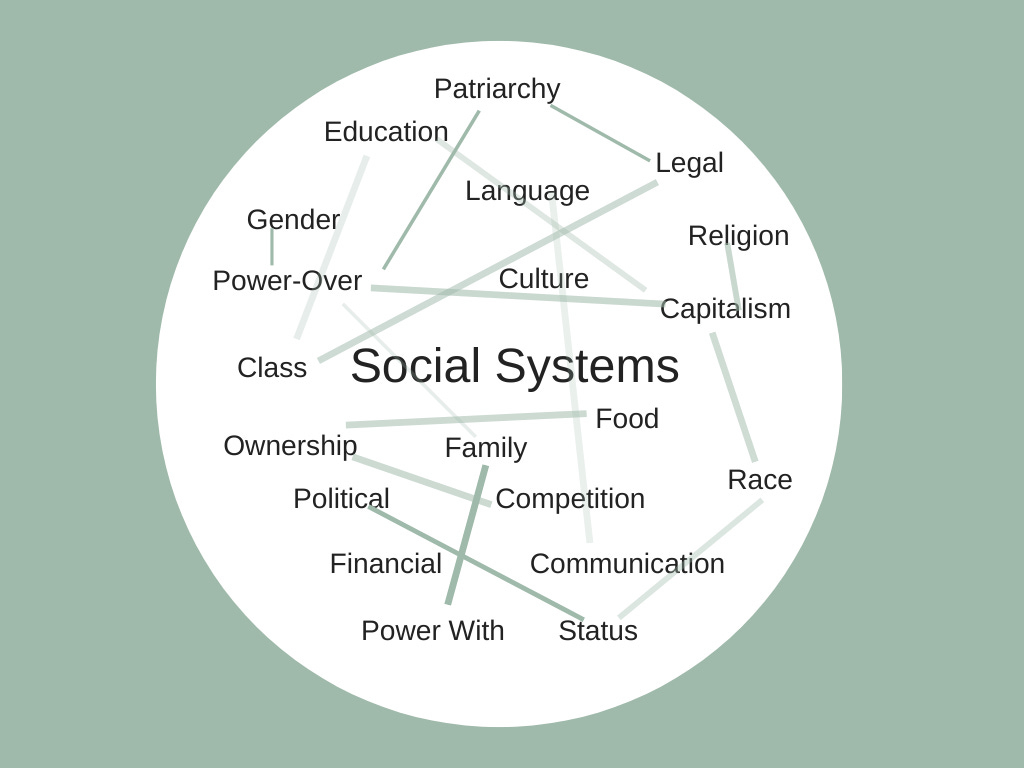
An example cluster map of interconnected relationships within social systems.
Next, let’s zoom in again to focus on the system of education which is a subsystem nested within social systems. Repeat the brain dump activity from above but this time grab a set of colored writing utensils to draw connections between the relationships that you identify. While drawing connections, use different colored writing utensils to create a key to highlight different dynamics. For example, you could use a red pen to highlight relationships where power dynamics are involved. You could use a green pen to highlight economic elements, blue to highlight environmental connections, and yellow for relationships with social impact. For example purposes, I’ve created the one below.
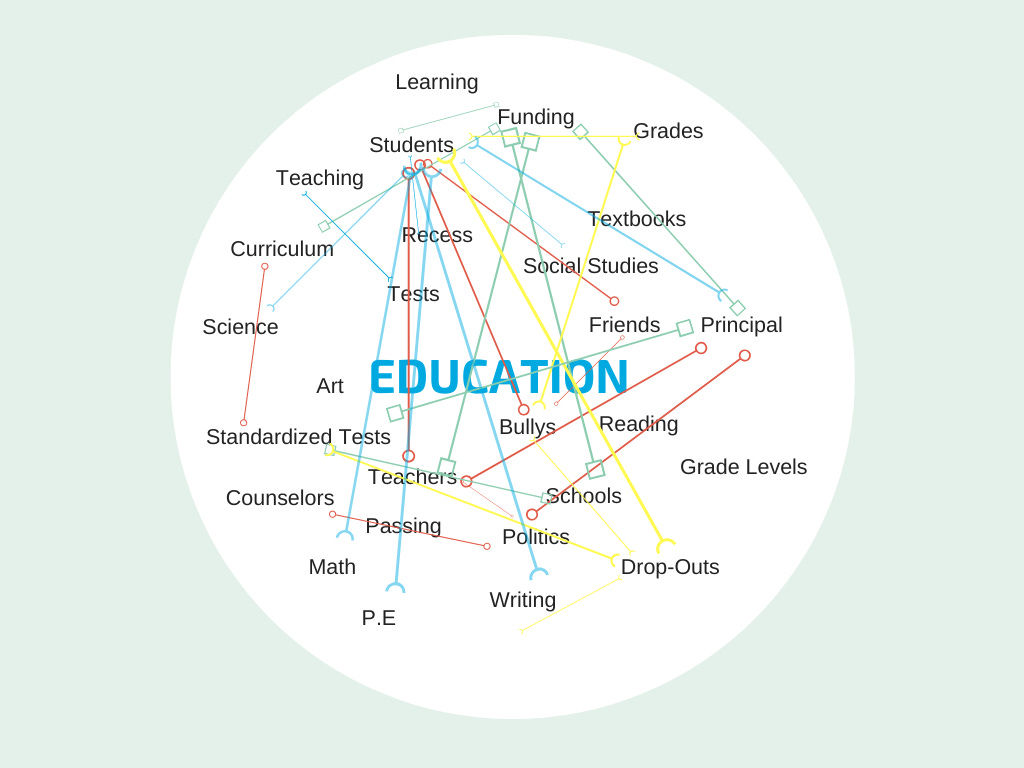
An example cluster map of interconnected relationships within the social system of public school education in the USA.
After creating a cluster map, step back and take a birds-eye view of the chaos and dynamic complexity that you've created on your sheets of paper. The goal is for you to use this to gain insights for a deeper understanding of the interconnections, interdependencies, and complexities within a system. When I started drawing concentric circle diagrams and cluster maps of social systems I began to think deeply about what I was seeing. I began to see clearly just how interconnected, interdependent, and complex everything truly is in our social systems.
Thanks for reading. I hope you’ll join me for my next post!
Click here to view previous posts.